
Profit percent, percentage changes and average prices – all three are very useful for business but for each one there are two calculation methods so there is a risk of confusion and error.
In this blog I go through all three and in each case I explain the two calculation methods and recommend which one to use.
Let’s go…
1. Gross margin % or mark-up % ?
Both of these figures are related to the gross profit, but they serve different purposes and are calculated differently.
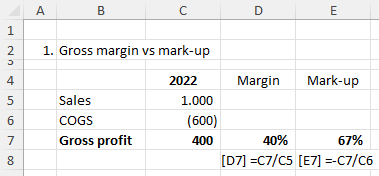
Gross margin %
- Margin tells you what proportion of your sales is left as gross profit.
- It is useful for comparisons e.g., of two different products, two business units, two businesses, two years, or plan and actual figures. It can also tell you how much you can reduce selling prices by and still make a gross profit.
- The calculation is gross profit / sales.
- In the example shown above this is 400 / 1000 = 40%.
That means that for every 100 Euros of sales, you are left with 40 Euros of profit (i.e. 40%).
Mark-up %
- Mark-up on the other hand tells you how much you add to your cost of goods sold (COGS) – i.e. what it costs you to buy or produce the products or services you are selling – to get your selling price.
- It is useful for calculating or assessing selling prices and is typically applied to individual products or groups of products.
- The calculation is gross profit / COGS; if your COGS figure is shown as a negative number, you can add a minus sign to your calculation so that the result is a positive number.
- In the example shown above this is 400 / 600 = 67%.
That means that for every 100 Euros of costs, you add 67 Euros on top to get your sales price. For 600 Euros of costs you would add 600 * 67% = 400 Euros, which represents your gross profit.
Recommendation
In general, I recommend the margin %. Sales prices are often set in comparison to competitors (market-based pricing) or what you believe the value to be for your customers (value-based pricing). The concept of mark-up is then not relevant, but of course, you should still consider your costs.
The margin % is also consistent with a “single size profit and loss account (P&L)” analysis where all P&L items are calculated as a percentage of sales. This extends the approach for comparing e.g. two years or two businesses from comparing just the gross profit to comparing all P&L lines.
2. Change in percentage points or percent?
A change in percent is often used to plan or assess e.g. costs. If you are analysing monetary values, there is usually no confusion. If costs have risen form 1,000 Euro to 1,200 Euros then we have a 20% increase = 200 Euros rise / 1,000 Euros.
Things can get confusing however when you compare the change in a percentage figure, such as (i) cost of goods sold (COGS) as a percentage of sales or (ii) interest rates, as shown in the example below. Here the interest rate has risen from 10% p.a. to 12% p.a. (unrealistic but simple figures for the purpose of illustration).
Note: I took this example from the website https://www.mathsisfun.com, so thanks to them!
Here we can calculate and talk about the change either in percentage points or in percent and we must be clear which one we are using.
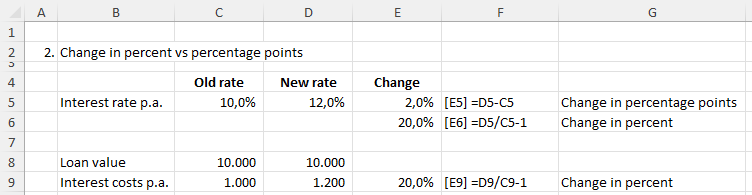
Change in percentage points
- The interest rate has risen from 10% to 12% so the change is simply 12% - 10% = 2% i.e. 2 percentage points and not 2 percent.
Change in percent
- The change in percent however is 20%, because the rise of 2% points is on top of the old rate of 10% = 2% / 10% = 20%.
- If we examine the interest costs, these have risen from 1,000 Euros p.a. to 1,200 Euros so we also have a 20% increase = 200 Euros rise / 1,000 Euros.
Recommendation
Both figures are correct, but you must be clear about which one you are using. In general, we are interested in the impact in monetary terms, which the change in percent figure tells us.
As the mathisfun website says, “When in doubt, use both. For example, say 'Interest rates increased by 2 percentage points today, meaning a 20% increase in interest payments.'"
3. Simple or weighted average?
In this final example we are selling two products: a small widget and a large widget. The small version sells for 10 Euros each and the large version for 20 Euros each. What is the average selling price?
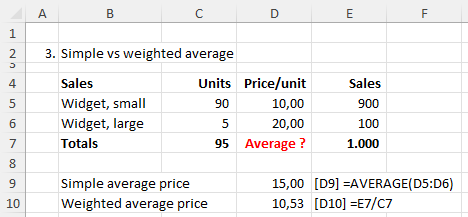
Simple average
- If you have no information on numbers of units sold (or you choose to ignore them), then you can calculate the simple average = (10 + 20) / 2 = 15 Euros
- This is really only true if you sell the same number of units of each product, which is probably not the case.
- In most cases, the simple average gives an incorrect understanding of the average price as we have not considered the numbers of units of each product sold. When we take these into account, this can have a dramatic impact on the average, as we will now see.
Weighted average
- The correct way to calculate the average selling price is to take the total sales divided by the total number of units sold.
- In this case we have 1,000 Euros total sales divided by 95 total units sold which gives a weighted average selling price of 10.53 Euros.
- This figure is much lower than the simple average of 15 Euros because it has been weighted by the number of units sold: we have sold many more units of small widgets than large widgets, so the weighted average price gets weighted towards the small widget price of 10 Euros.
Recommendation
Use the weighted average. To calculate this, you need to use total figures, as shown in the example above.
If you don’t have enough data to calculate the weighted average, state that the figure you show is a simple average. And don’t use it for calculations.